Qualex Chat
Qualex Chat


Archives for 2017

You are browsing the site archives by date.

Professional Sports League Case Study

Challenge

If you are the League and you have multiple teams, one of the missions is to drive growth in the fanbase for the teams, so they can grow their business. When data is within multiple teams’ silos, there is no way to get a good picture of the situation? In this League’s case, the teams’ operational data lived primarily within the teams’ operational source systems. This constrained the league with several independent “silos” of operational data. Accessing data in more than one system at a time proved both time consuming and inefficient. This acted as a blocker when diagnosing why specific events happened from a revenue generation/loss standpoint. The League struggled to predict the next market move to prescribe an effective action plan for customized demand generation and exponential revenue growth.

Solution

The League contracted with Qualex Consulting Services to implement an Enterprise Data Warehouse (EDW), Business Intelligence (BI) and Advanced Analytics solutions for both, the league and its teams. Qualex implemented iQ-Sports™, a sports/fan-centric data model, to support consolidating the league and team’s fan ticketing, demographics, financial, points of sales (POS) and customer relationship management (CRM) systems.

Benefits

Qualex addressed the challenges presented by these “data silos” by organizing data from the League’s various operational source systems into a consolidated data warehouse using Qualex’s iQ-Sports™ data model. With BI portals integrated to the warehouse, now team and league management have quick and easy access to key operational data to facilitate strategic decision making in a timelier manner.

Qualex developed a custom solution built specifically around the League’s business needs. The implemented solution leverages the League and Teams’ investment in technology to “do all the heavy lifting of data” so Team/League management can spend more time analyzing their business to make better decisions.

With Price Optimization and Attendance Forecasting models quickly deployed using the iQ-Sports™ database (including Weather data), the League was able to start structuring enterprise wide CRM initiatives as a result of a centralized infrastructure, data consolidation and analytic capabilities. This allowed the League and its teams to efficiently manage a team and league customer database and effectively execute marketing campaigns with the right offer at the right time.

Value

The League’s strategy was to communicate benefits and quick wins to key stakeholders. These quick wins were achieved by the centralization of data and the provisioning of advanced analytics and modeling. Starting with Qualex Price Optimization and Attendance Forecast models, a sample analysis and pilot campaigns were implemented to showcase the impact of fan data. As a result, the average sales per email increased from $56.42 to $109.01, meaning a 93% increase compared to the prior year campaign performance. Personalized pilot campaigns delivered targeted sales campaigns by favorite club, gender and past purchase information. This was calculated by utilizing click sales tracking, matching back email opens to purchases, and including historical performance coefficients

About Qualex

Qualex is a SAP Silver partner and a SAS Gold Partner. Qualex has more than two decades of extensive IT experience with Casinos, Hotels and Sports teams and clubs. What do these organizations all have in common? It is CRITICAL for them to engage effectively with their customers. The combination of Qualex industry expertise plus the latest technologies is helping SMEs innovate and transform their business with simplicity and proactivity at a low price point while delivering tangible value to their customers. Time, People, Priorities and Money shouldn’t be challenges anymore for SMEs.

“We have been working with the Qualex team since 2013 and we are very impressed with the commitment and knowledge they provide to us for the implementation of our new data warehouse and advanced analytics. We look forward to continuing to expand this effort and utilizing the findings to get a better view and understanding of our fans and their engagement across all clubs”. League Executive

Qualex Contact:
info@qlx.com
1.877.887.4727

Read More

IDC SMB Retail report

Retail: Small and Midsize Retailers Can Drive Revenue, Efficiency and Loyalty with Smart Adoption of Advanced Technology

THE BRIEF

Small and midsize retailers around the world are seeing their businesses transform in a variety of ways. These firms, typically with fewer than 1,000 employees, have been transforming themselves as customers seek new types of engagement and as suppliers expect higher levels of efficiency and effectiveness. New business models and new competitors are changing the way retailers do business. Rather than simply react to new threats, successful retailers are leveraging technology in new ways to sharpen business practices, improve agility, and better serve customers while strengthening the role of retailers in the supply chain. Through digital transformation including the effective engagement of the internet of things (IoT) to track inventory and sell through — the opportunity to maintain and gain competitive advantage can be significant.

INDUSTRY DEFINITION AND CORE ATTRIBUTES

Small and midsize retailers, typically fewer than 1,000 employees, span product strategies, merchandise categories; channels to market — omni-channel, online, and store; value propositions on price, service, convenience; customer segments and behavioral profiles served, and sourcing, supply chain, and distribution models. In short, the small and midsize retail sector is as broad and diverse as retail as a whole. Older small and midsize retailers established business and technology models in profoundly different settings than they face today, posing a challenge to those who may underestimate the extent and nature of change at hand. Most have been around for a long time and, because they are still small or medium- sized businesses, in the main they have grown slowly. In contrast, there are a few younger small and midsize retailers, some growing fast and shaking up their markets or creating new ones. However, for every innovator that breaks out to create a new market or product class, at least a hundred are stalled out or shrinking.

While many new small and midsize retailers are updating older business models with newer technologies, some are true innovators, shaking up retail with new product, category, store, and service concepts — some innovating in staid categories such as home furniture, others creating whole new categories such as athleisure wear, and still more carving out value in convenience such as ready-to-prepare meal subscriptions. As important as new, innovative merchandising can be, the greater challenge for many will be leveraging technology in ways that strengthen relations with supply chain partners as well as end customers.

The digital transformation of retail, from buying and sourcing to operations, merchandising, and sales, has changed the effect of economies of scale. Large retailers can definitely use them to reduce their “first costs” such as costs of goods sold, but small and midsize retailers can access source products just as easily as larger retailers — if not with greater ease.

INDUSTRY CONTEXT AND BUSINESS TECHNOLOGY DRIVERS

No matter their origin, value proposition, or merchandise sold, small and midsize retailers operate in markets undergoing profound changes in the customers they serve and competitors they face. Truth be told, as a group, the very largest U.S. retailers are losing market share, and those consumer expenditures are up for grabs. While that’s a positive trend for small and midsize retailers, other trends are not as favorable. Growth in real household incomes has been flat for years, and consumers are spending less of their disposable income on retail goods overall; in many categories, they spend significantly less as they spend more on experiences and services. Moreover, across many merchandise categories, market shares held by basics are declining — increasing variability in demand and accelerating cycle speeds. Omni-channel commerce gives more shoppers one-click access to many more retailers. Not surprisingly, agility is an imperative for success.

The consumer is changing too. Millions in the United States and billions worldwide are changing their shopping preferences and habits with greater speed and ease, putting retailers saddled with older enterprise, operational, and consumer-facing technologies at risk —
small and midsize retailers no less so than larger chains. Convenience, not consumption, is emerging as the new affordable luxury as the consumer adopts a new mantra — “My best experience anywhere is my minimum expectation everywhere.”

Small and midsize retailers tend to have a tough time of it as omni-channel commerce challenges one of their basic differentiators — being local. Being able to establish and reinforce a local market presence maintained by strong financials and customer engagement is the sweet spot for most successful small and midsize retailers, but building a local market presence is the aim of successful national chains too. For them, “thinking globally and acting locally” is a core strategy and operating principle, not an empty slogan. It plays out in just about every aspect of their business plans and practices. In merchandising, national retailers are focused on buying, assorting, allocating, replenishing, and pricing to local market conditions such as customer shopping patterns, competitors merchandising and marketing tactics, and attributes of large consumer segments.

Conventional retail is under siege, and the sting is felt most in the SMB tier. The rise of ecommerce sales, now a little more than 10% of total sales but vastly more and vastly less across merchandise classes depending on industry segments, has exacerbated a decades- old concern that the retail market is “over-stored.” Sales per square feet are declining. The industry has been hit by bankruptcies and store closures. National retailers are rethinking their store strategies, looking for new scale advantages in them such as fulfillment points and distribution centers in efforts to improve inventory productivity without cutting service levels.
Most want to reinvent their stores within their omni-channel strategies. Meanwhile ecommerce and omni-channel commerce retailers are expanding into new digital sales, marketing, and customer service channels.

SMALL AND MIDSIZE RETAILERS’ BUSINESS PRIORITIES: STABILIZE, MOBILIZE, AND OPTIMIZE

Small and midsize retailers need to orient their business and technology priorities against the industry context previously described and take pragmatic account of their own particular circumstances with particular regard to the relative success of the key dimensions of their
business and their technology and business process maturity. They are an optimistic lot, with 80% seeing changes in their competitive environment positively as posing more opportunity than risk.

Depending on these factors, they should focus on stabilizing, mobilizing, or optimizing various parts of their business.

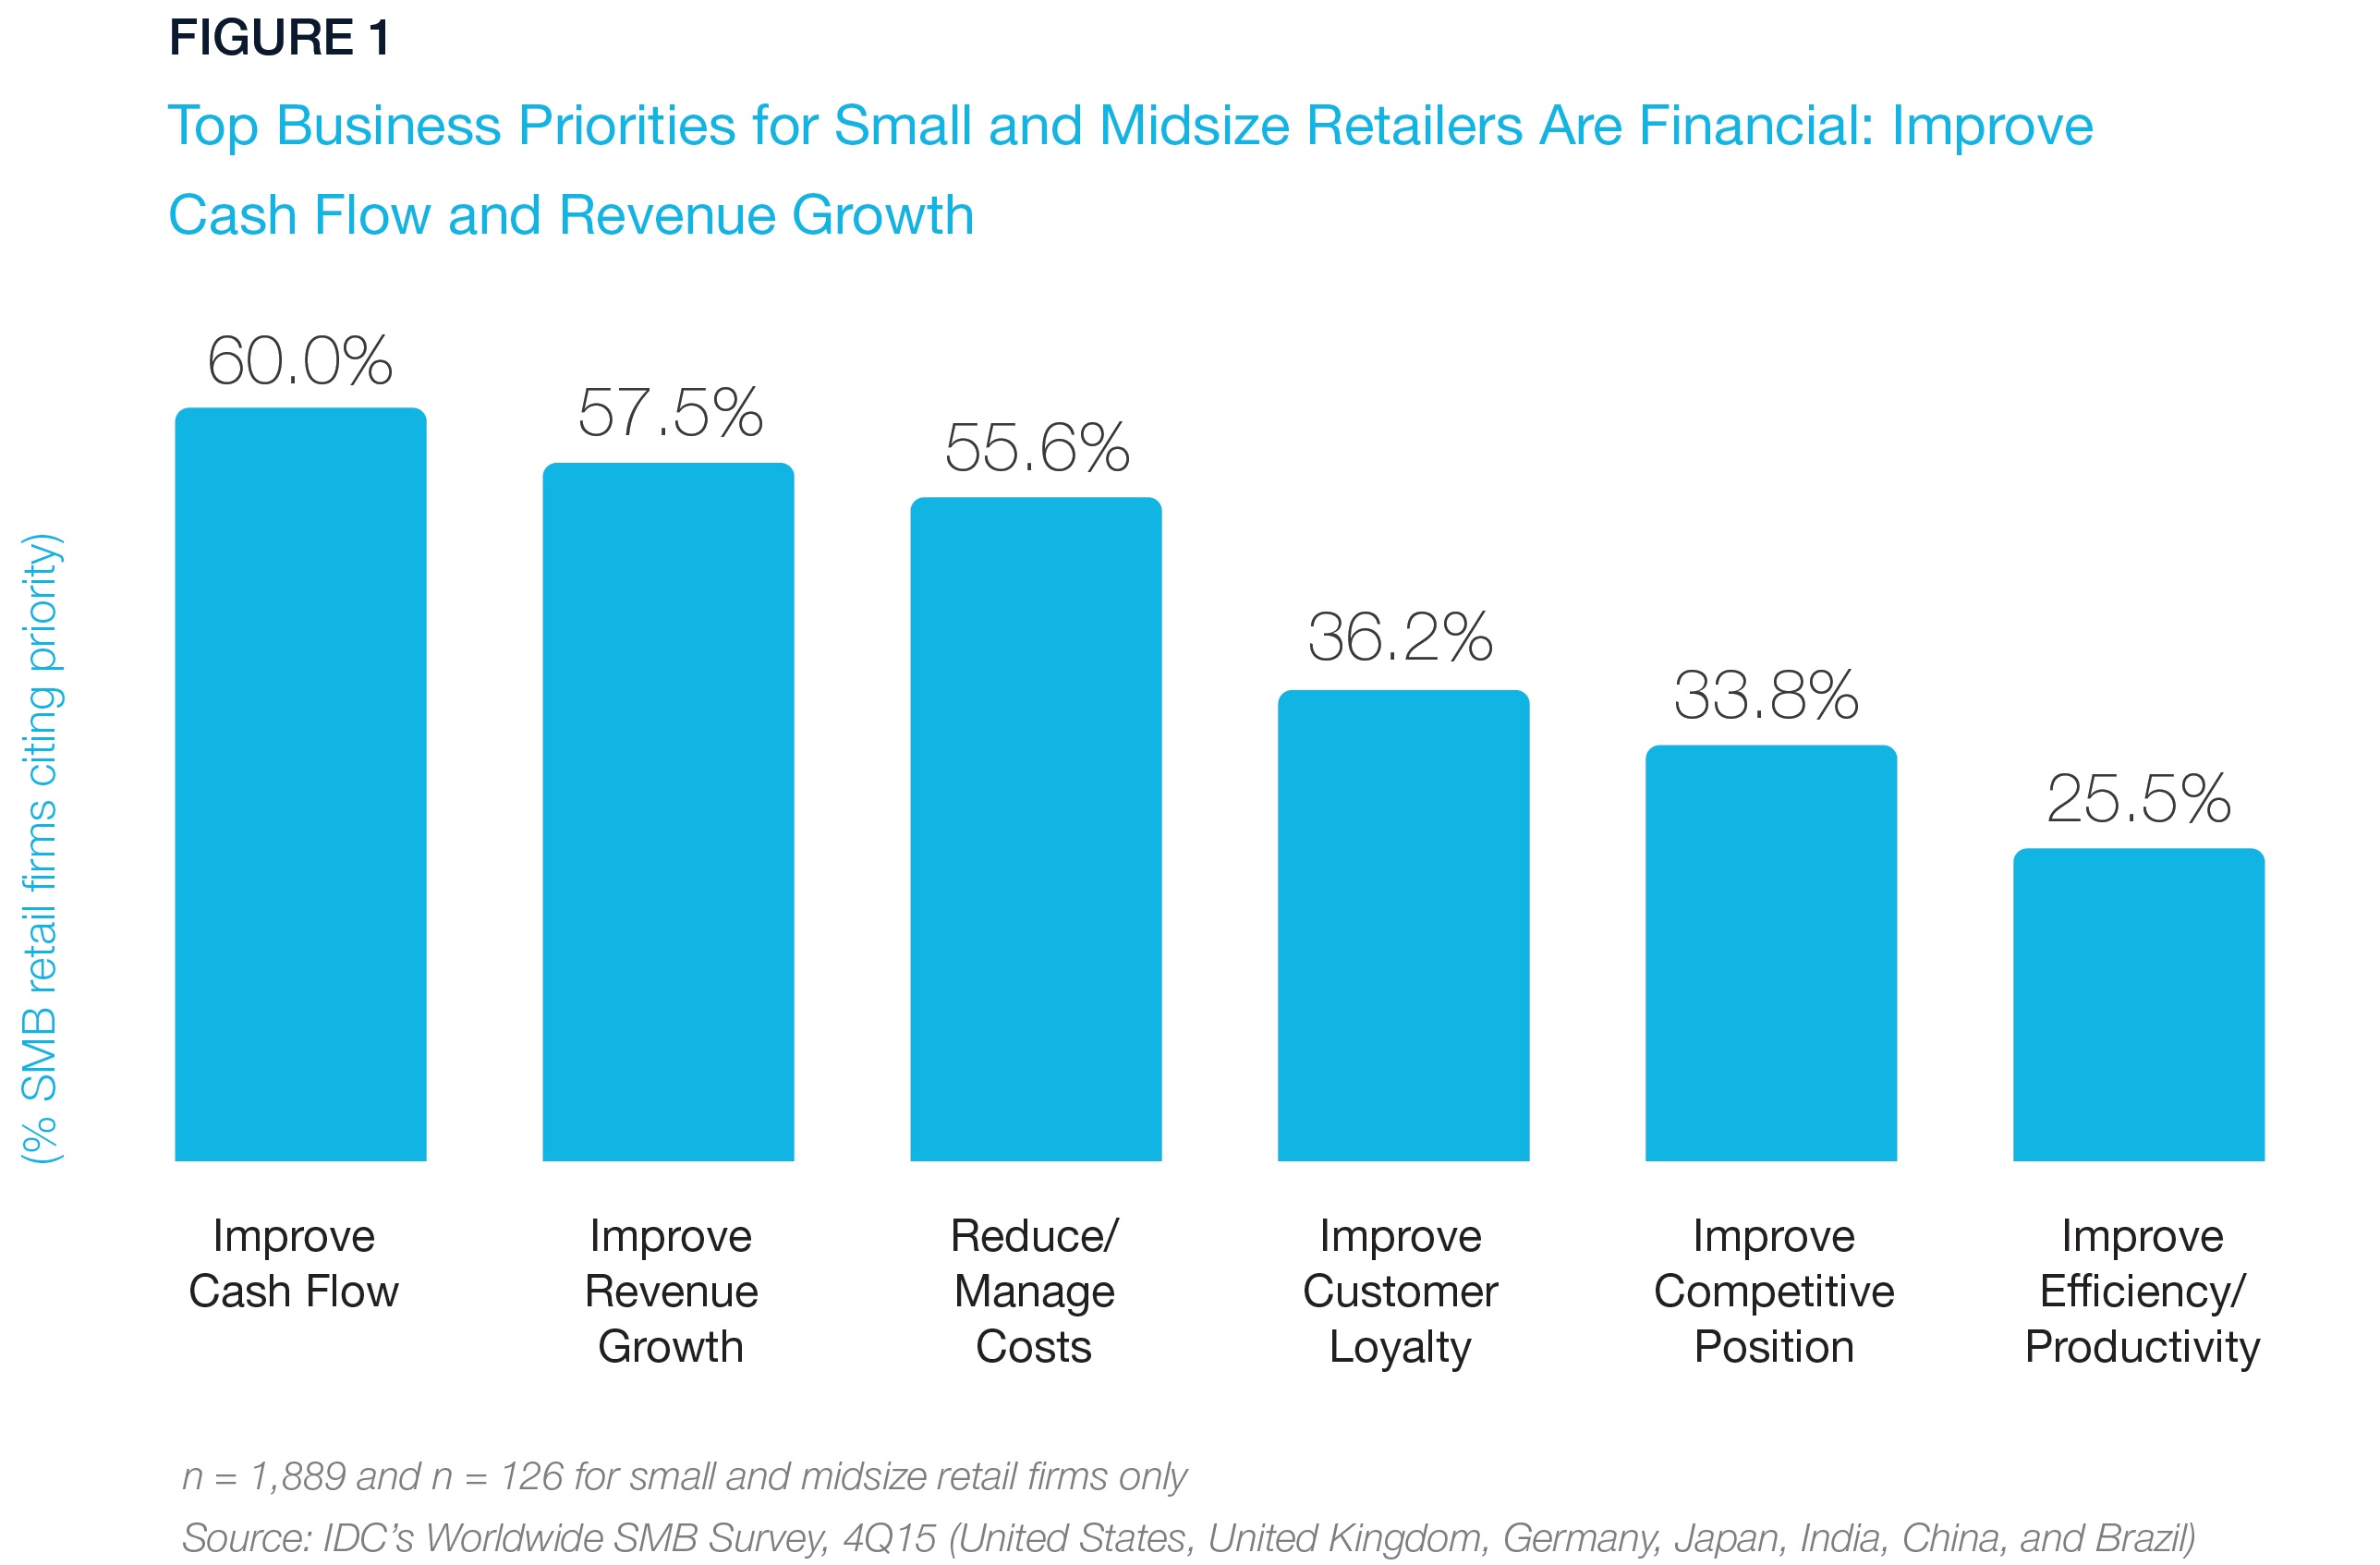
As Figure 1 shows, small and midsize retailers’ top 3 business priorities — improving cash flow, growing revenue, and managing costs — reflect these particular market conditions. Their fourth priority, improving customer loyalty, is tightly aligned with growing revenue. About one- third or more include improving customer loyalty and their competitive position at the top of their priorities, and a quarter include improving efficiency and productivity.

IDC_SMB-Retail 1

BALANCE INNOVATION AND CAUTION

As Figure 2 shows, small and midsize retailers have the good sensibilities needed to achieve business objectives with advanced technologies. They understand the urgency of their situation. Retail is buffeted by store closures and bankruptcies. Leaders are shifting capital budgets from investments in traditional physical store assets to investments in a wide
range of digital, mobile, and analytics information technologies, including in-store wireless infrastructure, as stores become fulfillment points and centers of digital engagement.

In several respects, they are bullish on technology. In particular:

  • One-third, 33%, of small and midsize retailers see advanced technology as an important competitive tool, a strategic resource. When asked a similar question, 38% of larger retailers plan to increase IT spending next year, with a majority citing growth as a key reason.
  • More than three quarters, 80%, don’t view themselves as cautiously investing in new technology. They’d rather take a technology risk than postpone the benefit their investment would yield. Of course, they want benefits most closely linked to their business goals to improve cash flow, accelerate revenue growth, and manage down costs.
  • They are true to form as retailers — optimistic. Four-fifths, 80%, see changes in their competitive environment positively as opportunity, not risk. They see successful innovation from start-ups and reinvention.
  • They are rapidly gaining experience with and confidence in digital transformation — already 60% have transformed their internal operations with the internet. Success is not rooted in technology but in technology adoption. Half, 50%, invest in technologies to manage costs with efficiency/productivity.
  • TCO and the commercial and support models for advanced technologies, especially cloud and managed service technologies, are tilting the playing field in favor of small and midsize retailers. However, only 21% say they are increasingly interested in cloud/ hosted solutions. We expect that many more small and midsize retailers will take to the cloud within the next two years. Most early-stage small and midsize retailers won’t even
    consider applications that aren’t cloud ready and mobile enabled. Most more established small and midsize retailers will follow suit, and some will accelerate their refresh cycle to gain these advantages sooner. Their often limited/constrained financial position will be less of a barrier in taking advantage of superior technology.
IDC_SMB-Retail 2

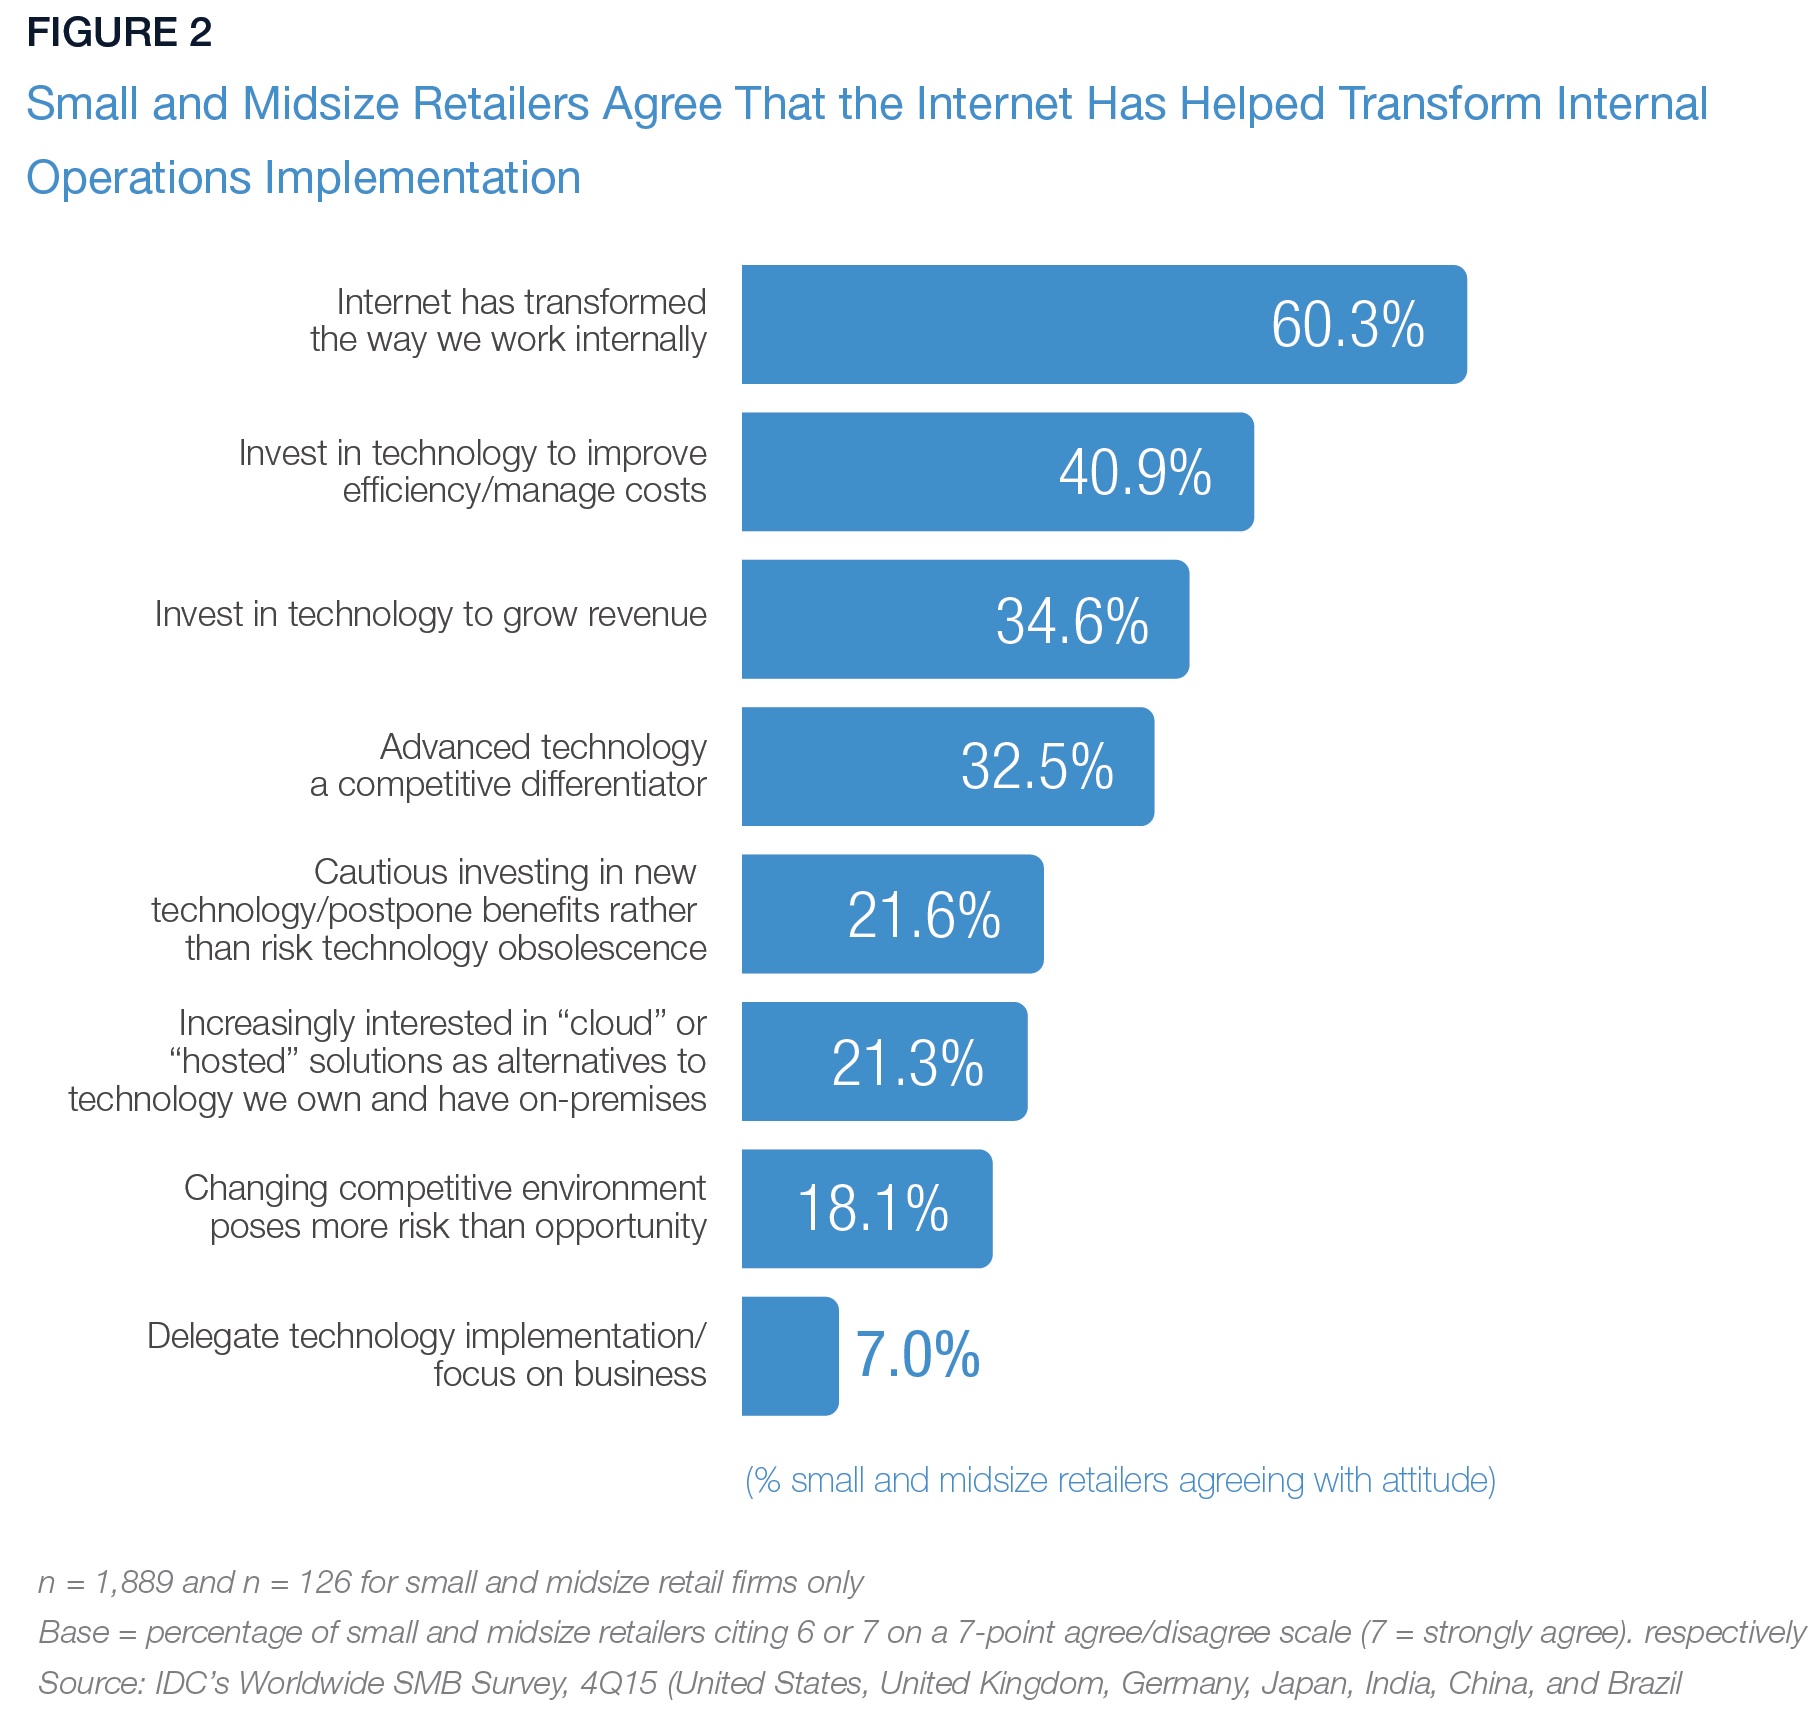
On other hand, continuing with Figure 2, we note that the SMB market remains cautious in some important regards:

  • Less than one-tenth, 7%, delegate technology implementation to others, but the implementation models are changing. The game is adoption, not implementation, with SaaS, and to a lesser extent in the SMB market, IaaS and PaaS. Technology vendors themselves carry the implementation and cost of services. Proof point: Three times this number, 21%, are increasingly interested in cloud/hosted alternatives to what they now run on-premises. IDC believes that small and midsize retailers as a group are much more likely to adopt cloud/hosted solutions for what they do not now run on-premises. The path to cloud/hosted solutions is gathering momentum fastest in customer-facing systems of engagement. Proof points there will pave the way to wider adoption of cloud/ hosted systems of record.
  • Already 35% of small and midsize retailers have invested in technology to grow revenue, compared with 57% that see revenue growth as a top priority. This gap will close. The classic barriers to technology investment — cost and risk — are falling. Simultaneously, there’s an ever-greater need to deploy technology smartly in key areas of the business.

KEY INITIATIVES

No matter how much their business changes over the next 5-10 years, small and midsize retailers need to stay focused on key processes, metrics, and outcomes reflected in their P&Ls, balance sheets, and customer engagement and satisfaction scorecards. Reaching for innovation shouldn’t unduly outstrip solidification and optimization of the fundamentals. Small and midsize retailers must strike the right balance and shift investment toward innovation as gains from investments in fundamentals taper off. In sum, they should adhere to the three directives discussed in the sections that follow.

Sharpen Inventory, Buying, and Pricing

  • Improve inventory productivity: Reduce inventory balance, increase overall turns, focus buys on better sellers and higher-margin products, and rationalize assortments and space.
  • Improve buying: Improve vendor and deal terms (discounts and price breaks).
  • Enable capabilities: Focus on demand forecasting, replenishment, pricing, category resets/NPI, and space optimization.

Drive Revenue Growth Through Customer Engagement and Better Merchandising

  • Increase same store sales/space productivity: Rapid refresh of categories and on- trend products, assortment localization, and improved pricing.
  • Improve customer sales: Average transaction value, increased wallet share in shopped categories, extended reach into under-indexed categories, and shopping frequency.
  • Improve the shopping experience: Make shopping easier and more convenient with connected contextual omni-channel marketing and personalized promotions supported by digital channels.

Solve for the “Reduce Cost/Improve Service for Success” Equation

Initiatives to improve cash will go a long way toward improving this trade-off. In addition, small and midsize retailers should invest to improve customer service in stores and increase store labor productivity. More generally, they should use technology to reduce process variability with better data and analytics.

Additional key points are as follows:

  • Store labor is the number 1 expense after the cost of goods sold, but retailers are hard- pressed to continue in the mindset of accepting reductions in customer service and store operations in order to manage down labor expense. Smart, targeted investment in store technologies can improve this trade-off dilemma.
  • Investing in technologies to reduce or slow growth of costs is a good strategic guideline. Key cost drivers to address include process variability and non-conformance, slow decision making, poor quality data for decision making, and slow, partial dissemination of new practices and policies.

To Download the report Click here

Read More

Retail Analytics Model Catalogue

Business Challenges: 

Small and mid-sized enterprises (SMEs) have a greater need for predictive capabilities, and less margin for error. The ability to project what will happen—and make decisions that change those trends for improved revenues and margins—is key. Qualex uses predictive analytics to:

  • Make real-time offers
  • Drive product recommendations
  • Improve sales forecasts
  • Increase profitability
  • Optimize marketing campaigns
     

Qualex leverages the power of predictive analytics accessible to SMEs in real-time. We provide customers with powerful and actionable insights, combining the latest technologies and third-party data to support scenarios such as better sales forecasting, improved anticipation of demand and better predictability across the business.

Qualex offers a complete predictive analytics solution and a modern analytics development platform, packaged specifically for SMEs.

Benefits: 

Qualex fuels digital transformation across the business with predictive analytics:

  • Customer Churn. For small businesses, losing customers and the resultant revenue can be very expensive, particularly when it comes to replacing the customer. Predictive analytics can help identify characteristics related to customer churn and use that information to address issues like dissatisfaction or product quality and make the changes required to protect that revenue and keep customers happy.
  • Product Propensity. Companies can leverage data outside their organization (for example, online behavior metrics like social media and product sentiment) and combine it with operational data and customer purchasing patterns to gain significant competitive advantage. This approach can help companies predict which products customers are likely to buy and devise new ways to maximize those channels.
  • Logistics & Operations. Leveraging historical data and training predictive models to identify risk (particularly with IoT data) can help companies move from monitoring operations to predicting future events before they impact them and help them to improve logistics.
  • Finance. The ability to forecast at a fine-grained level to gain a clearer view of orders, revenue, and inventory demand can introduce more accurate predictions that can improve the bottom line.
Read More

Hospitality Report Catalogue

Qualex delivers hospitality-specific BI, CRM and mobile solutions that define IT strategies drive systems selections and target business process and IT infrastructure review. Qualex’s enterprise solutions include Enterprise Intelligence Platforms that integrate individual technology components into a single, unified system. This results in an information flow that transcends organizational silos, diverse computing platforms and niche tools, while also delivering new insights to drive increased value for any organization. With our iQ-Hospitality Data Model we provide consistent reporting and analytical platform for predictive analytics.

iQ-Guest™ Application

Qualex Guest Application provides the fastest and most responsive form of communication with guests ranging from hotels to restaurants. Enhance your guest loyalty by letting your guests know you care. QPA features automated targeted SMS for guest campaigns; constantly keeping them updated on activities and events of interest increases loyalty.

iQ-Guest™ insures they are informed on the latest campaigns, events and special discounts. It also lets guests know you remember them personally by sending them personal alerts such as birthday specials or anniversary offers. By offering not only bulk SMS and individual SMS sending options, QPA also schedules: automated SMS, promotional SMS, email forwarding and database integration. QPA sets the trend for a guest SMS applications.

Some of our clients include:

Hospitality Report Catalogue

Qualex projects with Seminole HardRock Hotel, Galaxy Entertainment, Grupo Punta Cana:

  • Implementing our iQ-Hospitality data model
  • Trips Report
  • Hotel Stays Report
  • Comp Report
  • Revenue Report by Geography/ Demographics
  • Inactive Guest / Past Due Report
  • Guest Due Now Report
  • Potential New Business Report
  • Incliners/Decliners Report

Qualex Solutions Include: iQ-Support™

 Qualex iQ-Support™ is an internet-driven solution for organizations that, after implementing software solutions, need additional support to maintain their system’s operation. Qualex offers bundles of consulting hours from its specialized consultants in Data Integration, Data Warehousing Construction, Business Intelligence Reporting and Sophisticated Analysis. All these services are provided at a low cost, with high quality and maximum accessibility.

Ticketing & Point of Sales Operations

Reporting & analysis that benefits Ticketing and POS Operations:

  • Arena POS per Game Report
  • F&B Sales by Store and Terminal
  • Point of Sales Map Analysis by Product
  • Ticketing Analysis Report
  • Ticketing Customer Analysis
  • Comparative Time Series by Net Revenue
  • Ticket by State Analysis
  • Owed-Price-Paid Amount Analysis

Hotel and Hospitality

Reporting & analysis that benefits Hotel and Hospitality:

  • Dashboard(s)
  • Segment Value Report
  • Total Property Value Report
  • Bookings by Source Group
  • Turn Down Tracking (web usage)
  • Daily Report Package
  • Daily Pickup Reports (by segment)
  • Weekly Revenue Report Package
  • In House Report
  • Pace Report
  • Cash vs. Comp (by month and room type)
  • Segmentation Analysis Reports
  • Market Segment Pickup Report

Marketing
Reporting and analysis that would benefit Marketing:

  • Dashboard(s)
  • Additional Campaign Response reporting
  • Marketing Response Result Reports
  • Model Results for better future performance

Accounting
Reporting and analysis that would benefit Accounting:

  • Daily Revenue Reports (showing Cash vs. Comp data)
  • Comp Revenue Report
  • Comparison of Events/Initiatives
  • Comp Report per Person per Day
  • Marketing Automation
  • Customer Retention

Qualex Solutions Include: iQ-Support™ 

Qualex iQ-Support™ is an internet-driven solution for organizations that, after implementing software solutions, need additional support to maintain their system’s operation. Qualex offers bundles of consulting hours from its specialized consultants in Data Integration, Data Warehousing Construction, Business Intelligence Reporting and Sophisticated Analysis. All these services are provided at a low cost, with high quality and maximum accessibility.

Hotel Operations
Reporting & analysis that benefits Hotel Operations:

  • POS Accounting Report
  • Hotel Data Reports
  • Hospitality Control Board Report
  • Inactive Report
  • Meters Report

Hotel Marketing
Reporting & analysis that benefits Hotel Marketing:

  • Campaign Promotion/Offer Report
  • Promotions Report
  • Monthly Hotel Analysis Report
  • Room Report
  • Guest Card Use vs. Actual Transaction Report
  • Daily Hotel Revenue Report

Guest Development
Reporting & analysis that benefits Guest Development:

  • Dashboard(s)
  • Guest Profit/Loss Report
  • Guest Revenue Maximization Tracking Report
  • POS Utilization Report
  • Top Guest Revenue Report
  • Top 5 Names/Winners/Losers Report

Service Commitment

Once an issue concerning the use of software is reported, Qualex agrees to assign a resource to verify the issue. In critical issues (High), this resource will be assigned within specific pre-determined business hours and for regular issues (Low and Medium), the resource will be assigned within one business day.

Read More

Grupo Punta Cana CaseStudy 2014

Grupo Punta Cana – Puntacana Resort & Club Company Overview: 

Puntacana Resort & Club is located in the Dominican Republic within the waters of the Caribbean Sea. Its 26 square mile resort offers countless recreation, relaxation and dining opportunities and now includes Tortuga Bay (54 rooms), The Westin Puntacana Resort & Club (200 rooms), Four Points by Sheraton Puntacana Village (125 rooms), Six Senses Spa, the Puntacana Ecological Foundation and diverse residential communities (Corales, Playa Serena, Hacienda, Hacienda del Mar, Arrecife, Tortuga Bay and The Marina), a full service marina, 8 restaurants, a shopping village (03 shops), a P.B. Dye designed golf course and 2 championship golf courses.

Grupo Punta Cana – Puntacana Resort & Club Objectives:

Puntacana Resort & Club struggled with accessing the data collected from their transaction-based, operational systems to build and develop Ad-Hoc reporting. The data was there, it was just difficult to get to it.

Qualex Solution: 

Leveraging our knowledge of hospitality operational systems, data warehousing, database marketing & analytics, Qualex implemented a solution that provided Puntacana Resort & Club’s database operational, marketing and tactical team with quick & easy access to their data. Prior to Qualex, building reports, dashboards and the analysis was a manual process and often took several days or weeks.

Overall Results:  

After this implementation, these tasks were demonstrated to be reduced to minutes. Time that is being traditionally used by the Casino staff to manually build and analyze reports and dashboards can be now used to evaluate & modify existing marketing strategies; thus, giving the property the ability to allow their data to drive strategic marketing solutions to increase traffic to the property.

Quote: 

“We didn’t know how to make the most out of all the tools we had on hands and Qualex helped us to discover that and get consolidated and useful reports with information that allows us to identify significant data, such as loyal customers. Thus, we can now create more direct and effective marketing campaigns. The iQ-Gaming Solution implementation also made us aware of inconsistent data in our Warehouse.” Ruben Tineo – SAP Competence Center Manager

Read More

Catalog of Predictive Models

Guest Segmentation Model: This model segments the population of guests using cluster analysis and decision trees. Segmentation is one of the first and most basic machine learning methods. Segmenting the population of guests into distinct segments is important because creating separate model for separate segments may be time consuming and not worth the effort. But, creating separate model for separate segments usually provides higher predictive power.

Overall Property Preference Model: This model uses logistic regression to identify whether a customer is attracted by Restaurants, Bars or Shops (or combination).

Customer Day Preference Model: This model looks at guest behavior by day and identifies the day preference for attending. This model can be extended to time of day preference. This model helps hotel managers with staffing and layout requirements when mixed with other analysis.

F&B Location Preference Model:  This model looks at carded spend across food venues to identify guest’s preference for eating. This model is useful for menu changes, and for the creation of marketing offers around F&B. For instance, it could show the steakhouse could benefit from opening earlier in the week lining up with when the big spenders are hoping to attend.

Hotel RFM Model: This model forecasts VIP guests using revenue for F&B and Entertainment as well as frequency of visits and days since last visit.

Read More

Qualex Healthcare Practice II

Project Overview:

Qualex Consulting Services, Inc. (QLX) currently provides BI solutions for one of the largest healthcare insurers in the US. QLX provides consulting and implementation expertise to develop ETL processes and BI reporting using OLAP and web technology to provide access to large amounts of data stored in the customer’s “Enterprise Data Warehouse.”

Our task was to work with the actuarial team to provide tools for analyzing up to 7 years of claim and enrollment data in a way that would allow for quick and easy analysis as well as a method for providing standard monthly reports. One of the challenges with claims and enrollment data analysis besides the massive amounts of data to be analyzed, is the non-additive nature of the data. Providing summarization of large data in a “cube” environment can become complicated when drilling into claim and enrollment data. Analysis fields like Utilization and Per Member/Per Month can present significant challenges when attempting to incorporate them into a multi-dimensional structure like OLAP Cube. For example, a common actuarial metric is the calculation of Per Member/Per Month cost, or PM/PM. The numerator in this ratio is total claims cost in dollars. The denominator is total members enrolled, including members who have no claim costs and are not represented in the numerator. This metric is a challenge in standard OLAP reporting tools because the numerator and denominator represent different populations at different levels of summation. If a user wants to look at the data across various levels of claims dimensions, such as CLAIM TYPE, the numerator will change depending on whether the user is looking at Inpatient, Outpatient, Professional or Drug claims. However, the denominator, the total population of members remains constant across these levels.

Qualex Solution:

There are several tools by the client to develop and surface OLAP cubes. To develop cubes, we used the latest technology available in the market. These tools assist the developer in defining the structure of the cube and handling big amounts of data in an effective way.

The developer defines dimensions and hierarchies, or drill paths, based on the anticipated approach an analyst might take to addressing business problems. The analysis variables or measures are also defined. To surface cubes to users there are several tools available. Each of these allows the user to analyze the data by examining slices, of the cube quickly and easily. However, Qualex can provide more than just tools. With our extensive experience using a variety of BI and ETL tools, we can not only develop a tool for analysis or reporting, but can help you better understand your data. Qualex can assist with designing data structures from the complex maze of data sources inside the typical insurers’ structure. We can work with your team to not only design a valuable reporting environment, but also provide training and expertise in a wide variety of areas.

Results:

  • Non-additive fields like Utilization and PMPM are key metrics in the health care industry to help spot trend in health care costs.
  • While actuaries have a wealth of OLAP tools available to them now to analyze the data in their organization, this important statistic is not available out of the box.
  • However, there are customizations that developers can perform to bring PMPM into the analysts’ arsenal of tools.
  • Qualex has proven experience in this area and understands the complex nature of these tasks.

Qualex Contact:
info@qlx.com
1.877.887.4727

Read More

Enter Your Details

    X