Screenshot 1
3-D surface plots allow you to explore complex multidimensional spaces in an interactive environment that can be rotated.
Screenshot 2
Motion-enabled bubble plots show the variation in the value of any specified variable over time, business segment and company name.
Screenshot 3
The prediction profiler with simulation and optimization capabilities can be used to meet specific financial goals by determining the best mix of four mutual funds in a portfolio.
Screenshot 4
This scatter plot with nonparametric density contours and marginal distributions shows where the data is most dense.
Screenshot 5
With categorical analysis, you can analyze multiple-response data from such things as surveys, defect records and clinical trials.
Screenshot 6
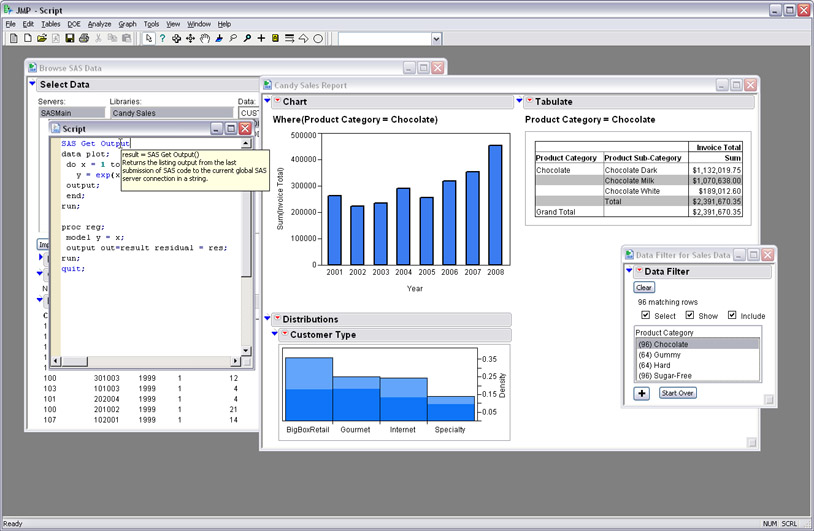
SAS Visual Data Discovery provides a point-and-click interface to the advanced analytic capabilities of SAS.